Explore comprehensive testing methods for fiber optic gyroscope key indicators, including zero bias stability, scale factor nonlinearity, and random walk coefficient (RWC). Learn step-by-step procedures, formulas, and equipment requirements for precision navigation and attitude control applications.
Fiber optic gyroscope is based on Sagna effect and is widely used for measuring angular velocity in navigation and attitude control. Key indicators typically include zero bias stability, scaling factor, random walk, bandwidth, noise, temperature characteristics, and so on. By measuring these indicators, the performance of fiber optic gyroscopes can be comprehensively evaluated, and system design and compensation algorithms can be optimized based on these data.
Definition: The average equivalent angular velocity output of a fiber optic gyroscope when there is no angular velocity input.
Test Equipment: horizontal reference device, fiber optic gyroscope output measurement recording device.
Test method: Fix the fiber optic gyroscope on a horizontal reference, with the input axis (IRA) pointing in the east-west direction. Record output data for at least 1 hour after power on, with a sampling frequency that meets the Nyquist criterion (≥ 2 times the highest frequency of the signal).
Calculation formula:

Where K is the scaling factor,  is the average output value.
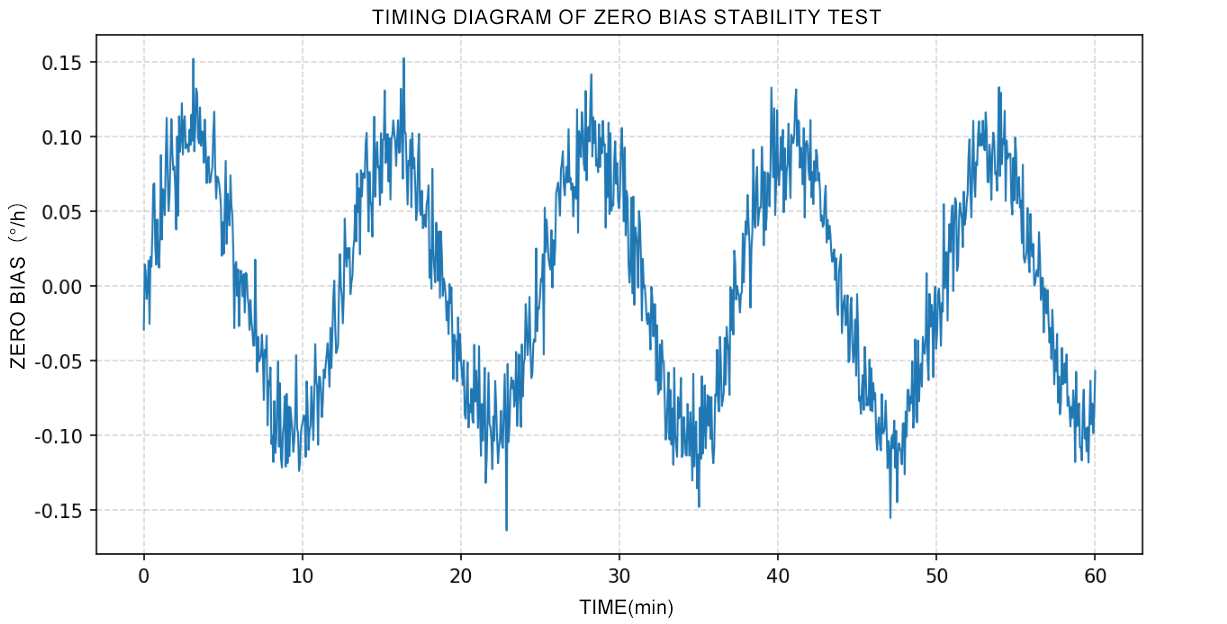
Definition: The degree of dispersion of zero bias output around the mean reflects short-term stability.
Test method: Same as bias test, but requires long-term data recording (at least 1 hour).
Calculation formula:

where:  : Zero bias stability, measured in degrees per hour (° ⁄ h)
 : The single-sided amplitude output of the fiber optic gyroscope
at time  .
.

Definition: Perform multiple power tests to ensure consistency of zero bias.
Test method: Repeat the zero-bias test for more than 6 times, with power off and cooling to room temperature at intervals between each test.
Calculation formula:
For each test data, process it according to formula (1), calculate the zero bias, and then calculate the zero-bias repeatability of Q tests according to the following formula.

Where,  : Zero bias of the i-th test;
 : Zero bias
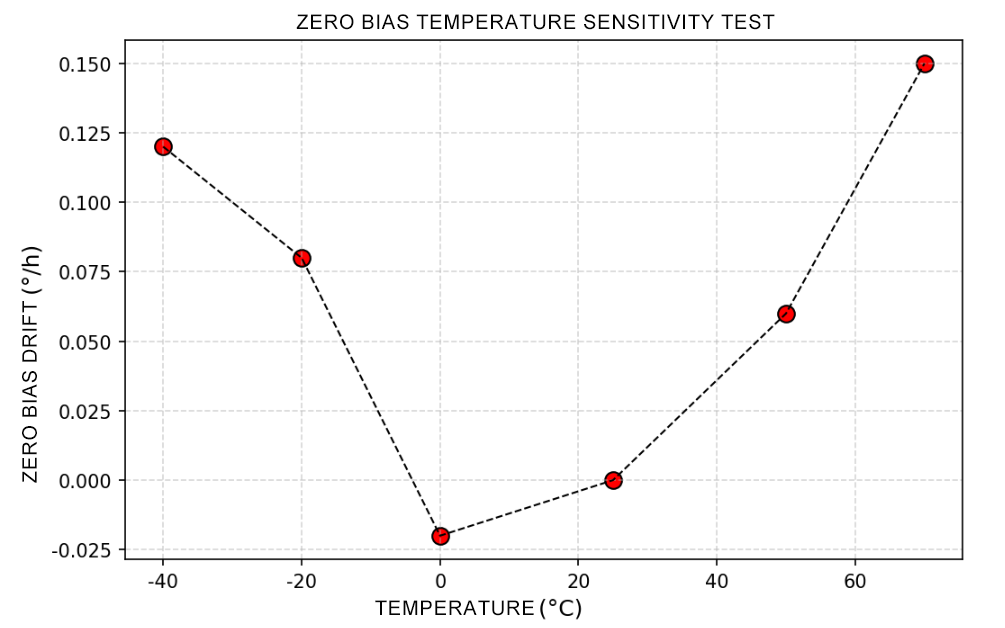
Definition: Zero bias drift caused by temperature changes.
Test method: Set different temperature points (covering the working temperature range) inside the temperature control box, and maintain a constant temperature for 30 minutes at each temperature point. Measure the zero bias at each temperature point and calculate the deviation from the room temperature zero bias.
Calculation formula:
The test data is processed according to formula (1), and the zero bias of the fiber optic gyroscope at room temperature and each test temperature point is calculated separately. The zero bias temperature sensitivity of the fiber optic gyroscope is calculated according to the following formula:

 :The i-th test temperature.
  :room temperature

Definition: Linear proportional relationship between output signal and input angular velocity
Test equipment: high-precision rate turntable (error<1/3 of the tested gyroscope index)
Test method: Select ≥ 11 angular velocity points (including the maximum input angular velocity) uniformly in both forward and reverse directions. Record the mean output of each point and fit a straight line using the least squares method.
Calculation formula:
Let  be the average output of the fiber optic gyroscope at the jth input angular velocity, and the scaling factor calculation method is as follows:
![]()
![]()

The linear model for establishing the input-output relationship of fiber optic
gyroscope is as follows:

Using the least squares method to calculate K, 


Where ∅ is the rotational speed of the speed turntable, measured in degrees
per second (° ⁄ s)
Definition: Output the maximum deviation relative to the fitted line.
Calculation formula:
According to the above method, the input-output relationship of the fiber optic
gyroscope is represented by fitting a straight line as follows:

Calculate the point-by-point nonlinear deviation of the output characteristics of
the fiber optic gyroscope according to the following formula:

Calculate the scaling factor linearity according to the following formula, and
create the nonlinear deviation curve of the fiber optic gyroscope output (the
horizontal axis represents the input angular velocity, and the vertical axis
represents the nonlinear deviation)

Test method: Test the scaling factor at different temperature points and calculate the deviation caused by temperature changes.
Calculation formula:
The test data is processed according to the calculation method of scale factor, and the scale factor of the fiber optic gyroscope at room temperature and each test temperature point is calculated separately. The temperature sensitivity of the scale factor is calculated according to the following formula:

Definition: Integral angular velocity error caused by white noise output.
Test method: Short time (tens of seconds) high-frequency sampling, analyze Allan variance.
Formula for calculating Allan variance:
a) There are n initial sample data of fiber optic gyroscope output values obtained at the initial sampling interval time  . According to the calculation formula for gyroscope zero bias, the output angular velocity of each fiber optic gyroscope output value is calculated to obtain the initial sample data of output angular velocity, as shown in the following formula:

b) For continuous data of n initial samples, k continuous data are grouped together, and the time length of the array is set to  , where τ equals
  , 2
, 2 , Calculate the average value of the array data for each time length.
c) Find the average difference between two adjacent arrays:

d) Calculate the variance of a set of random variables:
 …… (17)
Repeat the above process with different values of , and obtain a
  curve in the double logarithmic coordinate system, which is called the Allan variance curve. Using the Allan variance model below, the coefficients are obtained through least squares fitting, and then the random walk coefficient RWC is calculated:

The key indicator testing of fiber optic gyroscope is a bridge connecting research and development with practical applications. By quantitatively verifying performance, ensuring reliability, and meeting standard compliance, it ensures its "precision, stability, and usability" in military and civilian high-precision fields, while laying the foundation for technological innovation and cost optimization.

Xml Privacy Policy Blog Sitemap
copyright @ Micro-Magic Inc All Rights Reserved.
 Network Supported
